- English (UK)
- English (India)
- English (Canada)
- English (Australia)
- English (South Africa)
- English (Philippines)
- English (Nigeria)
- Deutsch
- Español (España)
- Español (México)
- Français
- Italiano
- Nederlands
- Polski
- Português (Portugal)
- Português (Brasil)
- Русский
- Türkçe
- العربية
- Ελληνικά
- Svenska
- Suomi
- עברית
- 日本語
- 한국어
- 简体中文
- 繁體中文
- Bahasa Indonesia
- Bahasa Melayu
- ไทย
- Tiếng Việt
- हिंदी

Freeport-McMoran Copper & Gold Inc (FCX)
Freeport-McMoran Copper & Gold Inc stock price live, this page displays NYSE FCX stock exchange data. View the FCX premarket stock price ahead of the market session or assess the after hours quote. Monitor the latest movements within the Freeport-McMoran Copper & Gold Inc real time stock price chart below.
What Is the Freeport-McMoran Copper & Gold Inc Stock Price Today?
The Freeport-McMoran Copper & Gold Inc stock price today is 68.70.
What Is the Stock Symbol for Freeport-McMoran Copper & Gold Inc?
The stock ticker symbol for Freeport-McMoran Copper & Gold Inc is FCX.
Is FCX the Same as $FCX?
$FCX is a common way to refer to the Freeport-McMoran Copper & Gold Inc ticker symbol in social media, forums, and online discussions. The dollar sign is a shorthand convention used to indicate that it is a stock ticker symbol
What Stock Exchange Does Freeport-McMoran Copper & Gold Inc Trade On?
Freeport-McMoran Copper & Gold Inc is listed and trades on the NYSE stock exchange.
Is Freeport-McMoran Copper & Gold Inc a Good Stock to Buy?
Determining whether Freeport-McMoran Copper & Gold Inc—or any stock—is a good buy requires comprehensive analysis. To evaluate its potential, users can sign up to InvestingPro, where they can assess the current Freeport-McMoran Copper & Gold Inc share price compared with the fair value and other essential metrics.
You can find more details by visiting the additional pages to view historical data, charts, latest news, analysis or visit the forum to view opinions on the FCX quote. (ISIN: US35671D8570)
Fair Value
An estimate of a stock's true price based on valuation models like discounted cash flow, peer valuation multiples, and dividend discount models.
Day's Range
67.54
69.46
52 wk Range
32.12
69.75
Earnings results expected in 7 days
1/2
Fair Value
An estimate of a stock's true price based on valuation models like discounted cash flow, peer valuation multiples, and dividend discount models.
Day's Range
67.5469.46
52 wk Range
32.1269.75
Key Statistics
Edit
Prev. Close
Open
Volume
Average Vol. (3m)
1-Year Change
Book Value / Share
Fair Value
Fair Value Upside
Market Cap
Shares Outstanding
Revenue
Net Income
EPS
EPS Growth Forecast
Next Earnings Date
(0.88%)
Dividends Payment Streak
P/E Ratio
Return on Assets
Return on Equity
Gross Profit Margin
Price/Book
EBITDA
EV/EBITDA
Beta
FCX Scorecard
Company’s Health
Assesses a company's financial position by analyzing its market value, financial ratios, industry benchmarks, and competitors.
UnlockFair Value
An estimate of a stock's true price based on valuation models like discounted cash flow, peer valuation multiples, and dividend discount models.
Unlock PriceTechnical Analysis
Strong Buy
Price Target
68.64
Downside
-0.09%
Members' Sentiments
Bearish
Bullish
ProTips
Tips that distill complex financial data into concise, actionable investment insights.
Trading at a high P/E ratio relative to near-term earnings growth
- Freeport Mcm receives Investment Bank Analyst Rating Update
- Investing.com
Pro - Freeport Mcm receives Investment Bank Analyst Rating Update
- Investing.com
Pro - Freeport Mcm receives Investment Bank Analyst Rating Update
- Investing.com
Pro
- Freeport Mcm receives Investment Bank Analyst Rating Update
- Investing.com
Pro - Freeport Mcm receives Investment Bank Analyst Rating Update
- Investing.com
Pro - Freeport Mcm receives Investment Bank Analyst Rating Update
- Investing.com
Pro
Technical Analysis
Summary
Strong Sell
Sell
Neutral
Buy
Strong Buy
Strong Buy
Technical Indicators
Strong Buy
Moving Averages
Strong Buy
Freeport-McMoRan Inc. engages in the mining of mineral properties in North America, South America, and Indonesia. It primarily explores for copper, gold, molybdenum, silver, and other metals. The company’s assets include the Grasberg minerals district in Indonesia; Morenci, Bagdad, Safford, Sierrita, and Miami in Arizona; Chino and Tyrone in New Mexico; and Henderson and Climax in Colorado, North America, as well as Cerro Verde in Peru and El Abra in Chile. Freeport-McMoRan Inc. was formerly known as Freeport-McMoRan Copper & Gold Inc. and changed its name to Freeport-McMoRan Inc. in July 2014. The company was incorporated in 1987 and is headquartered in Phoenix, Arizona.
Freeport-McMoran Copper & Gold Inc SWOT Analysis
Regulatory Landscape | Delve into FCX's potential benefits from US copper tariffs and its ability to navigate complex regulatory environments in key operating regions like Indonesia |
Market Dynamics | Explore FCX's position as a major copper producer, its gold exposure, and how it's adapting to short-term demand softening and long-term copper market outlook |
Financial Projections | Analysts forecast substantial growth for FCX, with a 12% increase in EBITDA and 58% rise in EPS by 2026, driven by potential tariffs and market conditions |
Copper Giant's Outlook | Freeport-McMoRan navigates shifting market dynamics and global pressures while maintaining a strong financial health score in the Metals & Mining industry |
Freeport-McMoran Copper & Gold Inc Earnings Call Summary for Q4/2025
- Freeport-McMoRan's Q4 2025 results exceeded expectations with EPS of $0.47 (67.86% above forecast) and revenue of $5.63 billion (6.63% above forecast), while stock rose modestly by 0.28%.
- The company distributed $5.7 billion to shareholders through dividends and share repurchases, with adjusted EBITDA for the year reaching nearly $10 billion, consistent with 2024 levels.
- Management projects 2026 EBITDA between $11-$19 billion depending on copper prices, with plans to increase U.S. production by 8% and restart the Grasberg Block Cave in Q2 2026.
- CEO Kathleen Quirk highlighted copper's critical role in electrification, with the company forecasting copper demand to double by 2040 driven by AI, data centers, and electric vehicles.
- The Bagdad mine expansion investment decision is expected by mid-2026, with management targeting 85% production restoration in Indonesia operations by year-end 2026.
Last Updated: 01/22/2026, 11:41 AM
Read Full TranscriptFreeport-McMoran investor slides for Q4/2025
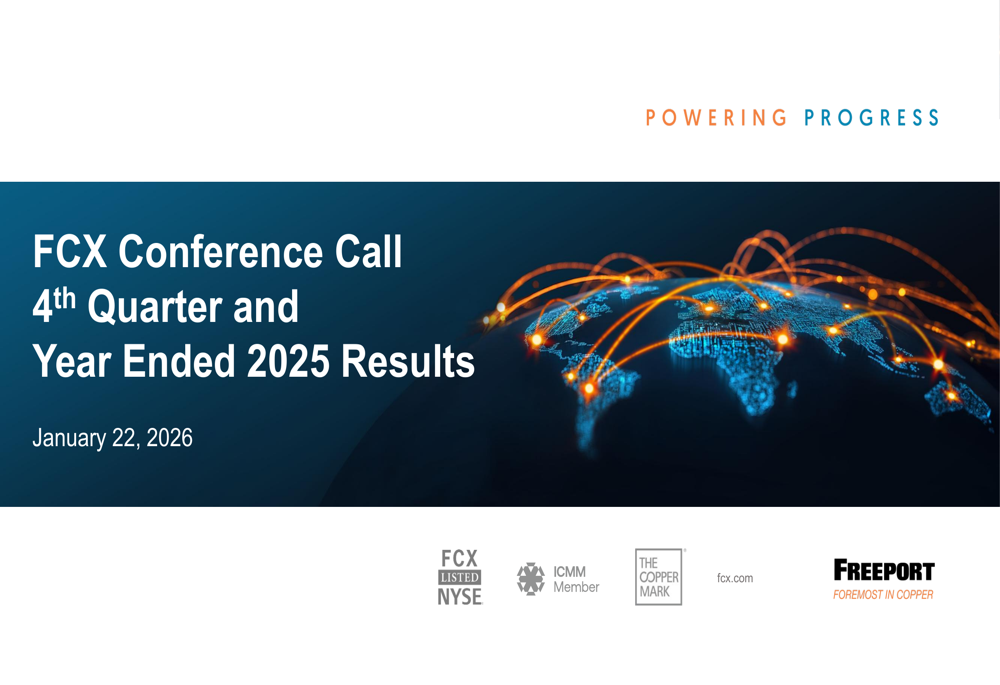
Last Update: Jan 22, 2026
See full investor slides
Compare FCX to Peers and Sector
Metrics to compare | FCX | Sector Sector - Average of metrics from a broad group of related Basic Materials sector companies | Relationship RelationshipFCXPeersSector | |
|---|---|---|---|---|
P/E Ratio | 44.9x | 21.3x | 3.4x | |
PEG Ratio | 2.64 | 0.43 | 0.00 | |
Price / Book | 5.2x | 4.1x | 1.6x | |
Price / LTM Sales | 3.8x | 3.2x | 1.4x | |
Upside (Analyst Target) | 2.5% | −57.9% | 24.4% | |
Fair Value Upside | Unlock | 6.8% | −1.5% | Unlock |
Analyst Ratings
19 Buy
2 Hold
1 Sell
Ratings:
22 analysts
Overall Consensus
Buy
Analysts 12-Month Price Target:
Average 68.64
(-0.09% Downside)
Earnings
Latest Release
Jan 22, 2026
EPS / Forecast
0.47 / 0.28
Revenue / Forecast
5.63B / 5.28B
People Also Watch
FAQ
What Is the Freeport-McMoran (FCX) Stock Price Today?
The Freeport-McMoran stock price today is 68.70 USD.
What Stock Exchange Does Freeport-McMoran Trade On?
Freeport-McMoran is listed and trades on the New York Stock Exchange.
What Is the Stock Symbol for Freeport-McMoran?
The stock symbol for Freeport-McMoran is "FCX."
Does Freeport-McMoran Pay Dividends? What’s The Current Dividend Yield?
The Freeport-McMoran dividend yield is 0.88%.
What Is the Freeport-McMoran Market Cap?
As of today, Freeport-McMoran market cap is 98.69B USD.
What Is Freeport-McMoran's Earnings Per Share (TTM)?
The Freeport-McMoran EPS (TTM) is 1.52.
When Is the Next Freeport-McMoran Earnings Date?
Freeport-McMoran will release its next earnings report on Apr 23, 2026.
From a Technical Analysis Perspective, Is FCX a Buy or Sell?
Based on moving averages and other technical indicators, the daily buy/sell signal is Strong Buy.
How Many Times Has Freeport-McMoran Stock Split?
Freeport-McMoran has split 4 times.
How Many Employees Does Freeport-McMoran Have?
Freeport-McMoran has 29000 employees.
What is the current trading status of Freeport-McMoran (FCX)?
As of Apr 16, 2026, Freeport-McMoran (FCX) is trading at a price of 68.70 USD, with a previous close of 68.27 USD. The stock has fluctuated within a day range of 67.54 USD to 69.46 USD, while its 52-week range spans from 32.12 USD to 69.75 USD.
What Is Freeport-McMoran (FCX) Price Target According to Analysts?
The average 12-month price target for Freeport-McMoran is 68.64 USD, with a high estimate of 81 USD and a low estimate of 30 USD. 19 analysts recommend buying the stock, while 1 suggest selling, leading to an overall rating of Buy. The stock has an -0.09% Downside potential.
What Is the FCX Premarket Price?
FCX's last pre-market stock price is 67.94 USD. The pre-market share volume is 46,260.00, and the stock has decreased by -0.33, or -0.48%.
What Is the FCX After Hours Price?
FCX's last after hours stock price is 68.80 USD, the stock has decreased by 0.10, or 0.15%.
Install Our App
Risk Disclosure: Trading in financial instruments and/or cryptocurrencies involves high risks including the risk of losing some, or all, of your investment amount, and may not be suitable for all investors. Prices of cryptocurrencies are extremely volatile and may be affected by external factors such as financial, regulatory or political events. Trading on margin increases the financial risks.
Before deciding to trade in financial instrument or cryptocurrencies you should be fully informed of the risks and costs associated with trading the financial markets, carefully consider your investment objectives, level of experience, and risk appetite, and seek professional advice where needed.
Fusion Media would like to remind you that the data contained in this website is not necessarily real-time nor accurate. The data and prices on the website are not necessarily provided by any market or exchange, but may be provided by market makers, and so prices may not be accurate and may differ from the actual price at any given market, meaning prices are indicative and not appropriate for trading purposes. Fusion Media and any provider of the data contained in this website will not accept liability for any loss or damage as a result of your trading, or your reliance on the information contained within this website.
It is prohibited to use, store, reproduce, display, modify, transmit or distribute the data contained in this website without the explicit prior written permission of Fusion Media and/or the data provider. All intellectual property rights are reserved by the providers and/or the exchange providing the data contained in this website.
Fusion Media may be compensated by the advertisers that appear on the website, based on your interaction with the advertisements or advertisers.
© 2007-2026 - Fusion Media Limited. All Rights Reserved.